

While I’ve had some good successes in locating fun roads by map, one of the shortcomings of a paper map is that the tight curves one can really lean into tend to be below the resolution displayed on the page. Paper atlases and electronic maps allow you to zoom in to see more detail, but then there is the problem of finding the gems in the sea of data. What I realized I needed was a way to highlight just the most curvy roads so that I would know where to explore next.

For those less familiar with the intersection of cartography and software, electronic mapping systems of the world (your Garmin/TomTom GPS, OpenStreetMap, Google Earth, MapQuest, Bing Maps, etc.) have databases that store sequences of thousands of coordinates, which linked together define the paths of roads across the surface of the earth.
While most of these systems rely on proprietary data sets that are inaccessible to anyone without the budget of a large corporation, the OpenStreetMap (OSM) project is publicly-accessible data set that maps the entire world. OpenStreetMap is a community driven project that anyone can add and edit — a Wikipedia for cartographic data. In some parts of the world the Open Street Map has better coverage than any commercial providers; in the US the original data was imported from the public domain USGS TIGER data set and has then been expanded and improved by the community.
I can get the raw data from the OpenStreetMap for the path of every road, but how to determine which ones are the most twisty? At the beginning I tried strategies such as calculating the ratio of distance traveled on a road versus the distance between the start and end points. Unfortunately all of these initial methods had situations that confused the algorithms (such as circular roads) or didn’t distinguish between fun curves and boring broad changes of direction that would only be exciting at far beyond the speed limit. What I eventually came up with is a process of calculating the radius of curvature at every segment of every road and then adding up the length of the most curvy segments to get a total distance spent cornering. The twistier the road, the more distance (and time) is spent cornering.
Curvature is a small command-line program that reads through the OpenStreetMap data, analyzes the shape of every road. It takes those results and filters out everything but the most twisty roads which are then output to a map database and KML (Google Earth) files. The Curvature source code is available on Github here: https://github.com/adamfranco/curvature
Calculating the curvature of a road

As mentioned above, each way (road) is made up of a sequence of points defined as a pair of latitude and longitude values. Each sequence of three points makes up a triangle where two of the sides are road segments with a hypotenuse between the 1st and 3rd points. Since we have the latitude and longitude of each point we can easily calculate the distances between them, but figuring out what the curvature of the road is at this set of points is a little tricky. Since the points aren’t evenly spaced the angle between the three points doesn’t tell us anything. Instead, we must go to the geometric relationship that says for every triangle there is a circumcircle that intersects its three points. Using the equations for the circumcircle, we can plug in the distances between the three points and come up with the radius of that circle. That circle’s radius corresponds to the radius of the road’s curve at the middle of the three points.
Here is a video explaining the process:
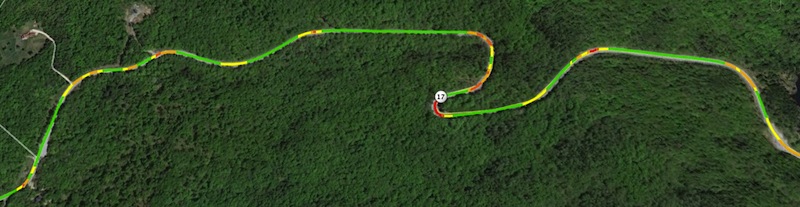
Once the curve radius for each segment has been calculated we can then step through each segment and classify it into a few buckets:
- Large-radius turns that we’ll consider “straight” and give a weight of “0”.
(Green segments in the image below) - Broad, sweeping turns that we’ll give a weight of “1”.
(Yellow segments in the image below) - Tighter turns that we’ll give a weight of “2”.
(Orange segments in the image below) - Super-tight corners that we’ll give a weight of “4”.
(Red segments in the image below)
Since numbered highways may go hundreds or thousands of miles, only a portion of which are twisty, each road is subsequently split into sections if it goes more than two miles without any curves that push a segment out of the straight bucket. This splitting process allows twisty sections to be highlighted alone without their adjoining long straightaways.
With each segment classified into a weighted bucket we can then multiply the length of each segment by its weight and sum the weighted lengths into a single number. This number is the curvature value of the road section and corresponds roughly to the number of kilometers that a motorcycle would be leaning into a turn when traveling the road section.
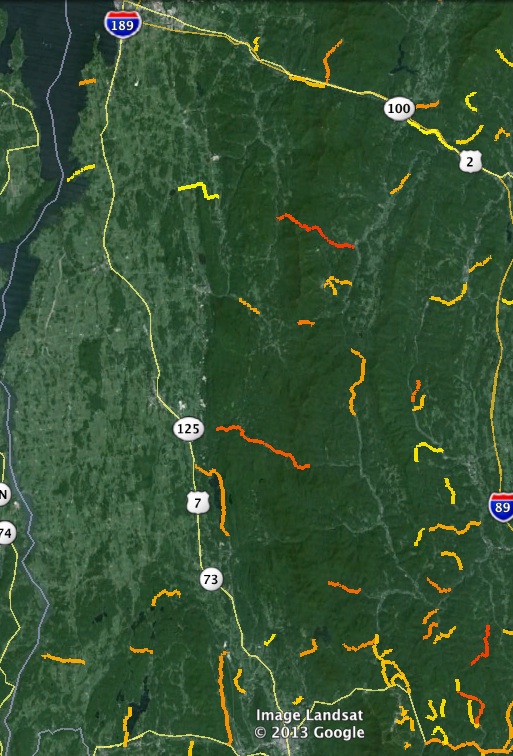
Once each road section has had its curvature value calculated, the entire data set is filtered to remove any road-sections below a given threshold. In the map and the KML downloads I provide two thresholds: curvature ≥ 1000 and curvature ≥ 300. The roads in the dataset are color-coded into a spectrum from yellow (least twisty) to pink (most twisty).
In addition to filtering out “straight” roads, Curvature will also filter out unpaved roads which are identified by their surface tag in OpenStreetMap. Unfortunately, at the time of this writing, much of the world doesn’t have universal coverage of surface tags, so Curvature takes the following actions:
- If there is an unpaved, gravel, dirt, etc. surface tag, filter out the road.
- If there is a paved, asphalt, or concrete surface tag, include the road and style it as thick and opaque.
- If the road is a primary, secondary, trunk, or motorway, include the road and style it as thick and opaque.
- If the road is a lower classification and there is no surface tag, include it, but style it as thin and translucent.
By styling the unknown-surface roads as less opaque, it provides a visual indication that these roads might be unpaved. Zooming in on the satellite imagery might be useful to confirm the road surface while you are at home — rather than traveling for hours only to find that your epic road is actually an unpaved logging track. As you identify unpaved roads, you can edit their surface tags in OpenStreetMap to improve the data for everyone.
Running Curvature
If you just want the results, I provide a web-map at roadcurvature.com/map/ and free downloads of the Curvature output files for the entire world at kml.roadcurvature.com. The map and downloads are automatically refreshed approximately every month. That said, some people may want to run Curvature themselves to customize the output to their needs.
When running Curvature you can build custom processing chains (as described in the README) that allow you to highlight the roads you are most interested in. For example if you live in the flat Midwest you can pass it a low curvature threshold to try to locate roads that have any curves. Give it a medium threshold and the output can help you find a more interesting route to work. Similarly if you want to find just the most absolutely crazy-curvy roads in a region give it a high threshold to filter out wheat from the chaff.
With the curvature-output-kml-curve-radius output, KML files will be generated with each road segment color-coded to match its curve radius. Green segments are above the threshold considered “straight,” while yellow are broad curves, orange medium, and red tightest:
This output is especially useful for validating the output from the program and finding bogus corners caused by jittery road-data.